
Deprecated: array_key_exists(): Using array_key_exists() on objects is deprecated. Use isset() or property_exists() instead in /nas/content/live/trees4future/wp-content/plugins/ht-knowledge-base/php/ht-knowledge-base-category-ordering.php on line 58
Deprecated: array_key_exists(): Using array_key_exists() on objects is deprecated. Use isset() or property_exists() instead in /nas/content/live/trees4future/wp-content/plugins/ht-knowledge-base/php/ht-knowledge-base-category-ordering.php on line 60
Chapter 3: Facilitation Tools
Calendars
What is the calendar tool?
Calendars are an analysis and planning tool. They help farmers anticipate how things change across seasons and times of the year. Calendars help participants think long term and avoid decisions that are based simply on what is happening right now (or happened last season). An effective calendar includes 3 elements: a time unit (e.g., months of the year) mapped across columns, a relevant variable (e.g., food availability, crop harvests) mapped in each row, and data collected in the cells of the calendar (e.g., checkmarks).When do I use the calendar tool?
In the context of Forest Gardens, you can use Calendars for two primary purposes:- Generating data and insights: helping farmers analyze patterns that reveal critical information for the design of the Forest Garden. Examples include mapping:
- Months when food is scarce.
- Months in which their field does not yield harvests.
- Seasonal changes in the sales price of their crops.
- Effort and labor needed for a given activity at any one time in the year.
- Planning: helping farmers map out when they should be undertaking specific activities to implement their Forest Garden design.
How do I use the calendar tool?
 Basic Components of a Calendar
The horizontal axis of a calendar, or the columns, represent time.
As a first step, work with the farmer group and understand the unit of time they use in their day-to-day lives. This could be the western 12-month calendar unit, seasonal calendars, or other religious calendars.
Calendars can start at different times of the year. For example, you can choose to start a calendar mapping food security at harvest time, or start a crop planning calendar with the rainy season. We recommend using the same month (or other equivalent) so farmers can compare calendars across sessions and build on their understanding.
The rows of the calendar include the variables you need to map. Let’s look at two commonly used calendars to understand the differences between a single variable and multiple variable calendar.
Single Variable Calendar: Seasonal Market Analysis
The figure below provides an example of a calendar that maps the market prices of different vegetables being grown by a farmer. The purpose of this calendar is to generate data and insights that will help farmers identify:
- Months during which they could get higher prices for their produce.
- Ways to store or harvest produce to sell during those months.
| Jan | Feb | Mar | Apr | May | Jun | Jul | Aug | Sep | Oct | Nov | Dec | |
 |
 |
|
 |
|
|
|
|
|
|
|
|
|
| Bean Prices
|
 |
 |
 |
|||||||||
| Sorghum Prices
|

Figure 1: Seasonal market analysis. This can be done by month or by season. You can use vegetable names or cutouts of pictures.
Since we are mapping the same type of information – prices for vegetables – this is an example of a single variable calendar.
Multiple Variable Calendar: Seasonal Farming Analysis
The seasonal analysis compares the inputs and outputs farmers get from their fields, along with nutrition and food needs of their families. It helps them identify:
- Family needs: lean months when their family needs more food and nutrition than available.
- Outputs: all harvests they get from their fields across food crops, vegetables, fuelwood and fodder.
- Input: the amount of effort they are expending on their fields at any given time of the year.
This analysis can help farmers move from cropping methods that require intensive effort during specific months, are at greater risk of crop failure, and associated with inconsistent food availability — to perennial cropping that distributes both effort and produce more consistently across the year.
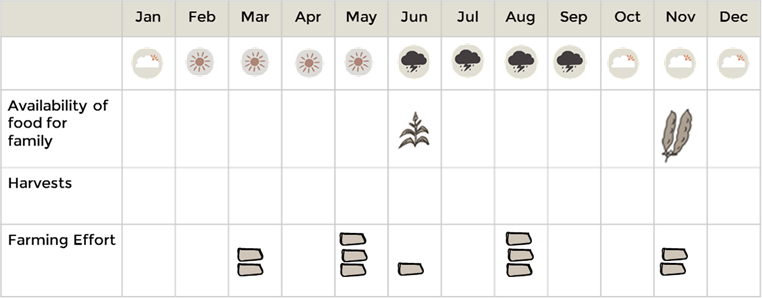
Figure 2: Seasonal farming analysis. This can be done by month or by season. You can write crop and produce names or use picture cutouts in the cells, or list them in separate rows and use checkmarks to indicate harvests across the year.
Since the calendar maps three different types of variables – food availability, harvests, and effort – this is an example of a multiple variable calendar.
The cells in the calendar capture the data you need for each item listed in the corresponding row. Here are the four types of information you can capture, along with ideas on how to capture this data:
- Lists. example includes names of produce listed or drawn within cells (illustrated in Figure 2).
- Presence or absence. example includes checkmarks used to indicate months in which farmers get harvests from their fields.
- Categories. example includes 3 types of smiley faces to indicate high, medium, or low prices for vegetables (illustrated in Figure 1).
- Quantity. example includes dots or bars to indicate volume of overall effort expended on the farm (illustrated in Figure 2).
Facilitating insight and action
Step 1: Clarify goals. For each calendar activity provide a clear checklist of what needs to happen by the end of the calendar exercise.
Step 2: Provide instructions and draw a sample. Draw a sample calendar clearly illustrating the columns or time unit, the rows (e.g., food scarcity, crops, effort), and the type of data needed for each (e.g., check boxes, smiley faces, bars). Provide materials needed to complete the activity.
Step 3: Facilitate group completion of the calendar tool. When working with a large group, create subgroups of 4-5 members. Each group should then complete the calendar exercise as per the instructions and sample shared with them. Let the groups know the amount of time they have to complete their calendars, and provide a 2 minute reminder before the time is up to help them wrap-up their discussions.
Step 4: Ask follow-up questions that facilitate learning. Provide an opportunity for calendars to be shared across subgroups, draw out insights and conclusions that help the farmers protect, diversify, and optimize their crops.
Using the two sample calendars we covered earlier in the ‘Basic Components of a Calendar’ section, here are examples of follow-up questions you can ask for each:
- Market Analysis – when are prices high, what makes them high? When are they low, what makes them low? Which months would you like to sell in? What could you do to sell more in those months?
- Seasonal Farming Analysis – What time of year does the Forest Garden produce the most? What time of year does the Forest Garden produce the least? Who has plants, in your Forest Garden, that you harvest during the lean months? What are these and when do you harvest them? What plants can you add to your Forest Garden to harvest during the lean months? What are the top three gaps to fill to improve the use of time in the Forest Garden?
Top View Mapping
What is top view mapping?
Top view mapping (also called horizontal mapping) helps create a diagrammatic representation of the group member’s farm. The map is drawn to approximate scale, and can be used to estimate the actual land area and border lengths. It includes: (1) farm boundaries, (2) key physical features within the farm, (3) neighboring features relevant to farming, and (4) an arrow to indicate North that helps orient the map. Forest gardens are strategically designed to cultivate plants that fill space both horizontally (across the ground) and vertically (from belowground to the top of trees’ canopies). The top view mapping tool equips the farmer with the perspective and information they need to fully utilize the horizontal land area available to them.When do I use top view mapping?
Top view maps should be used to:- Inform the initial design of the Forest garden.
- Inform decisions about which trees, plants, and crops will best diversify the Forest Garden.
- Periodically evaluate and assess opportunities to better utilize and optimize the Forest Garden.
How do I use top view mapping?
Materials The ability to erase and redraw with ease is essential when drawing maps. Materials most conducive to easily drawing maps include A4 paper sheets (tip: grid paper, if available, makes it easy to approximate scaled distances on paper), pencils, and erasers. Alternate, and more easily available materials can include chalk and boards/cardboards that are easy to carry but allow participants to make corrections as needed.
Scale
In order for the maps to help farmers make decisions about usage of space (e.g., how many trees of a certain span they can plant and what distance apart), it is important that the lines on the map represent the distance on the ground. If available, farmers can use a measuring tape to capture the length of the border and determine an approximate scale (e.g., 10 meter on land equals 1 cm on paper).
For the purposes of the Forest Gardens, it is adequate if farmers use their steps to measure distances, and equate one step to 1 meter of distance.
Key Components
The ability to erase and redraw with ease is essential when drawing maps. Materials most conducive to easily drawing maps include A4 paper sheets (tip: grid paper, if available, makes it easy to approximate scaled distances on paper), pencils, and erasers. Alternate, and more easily available materials can include chalk and boards/cardboards that are easy to carry but allow participants to make corrections as needed.
Scale
In order for the maps to help farmers make decisions about usage of space (e.g., how many trees of a certain span they can plant and what distance apart), it is important that the lines on the map represent the distance on the ground. If available, farmers can use a measuring tape to capture the length of the border and determine an approximate scale (e.g., 10 meter on land equals 1 cm on paper).
For the purposes of the Forest Gardens, it is adequate if farmers use their steps to measure distances, and equate one step to 1 meter of distance.
Key Components
 1.Boundaries.
When drawing the map of the farm, the boundary is the first feature to be defined. Spending time upfront to create an accurate border – shape of the farm is clearly defined and length of lines represent distances on the ground – makes it easy to complete the remaining map by simply adding in key physical features.
There should be no dispute regarding the boundary being drawn. The first step in the Forest Garden process is to plant a fence made of trees, a green wall, to secure the land. The trees provide protection and future income to the farmers, and could be at risk if planted on a disputed border.
2.Cardinal Directions.
Outside the boundary of the farm drawn on the paper, the map should include an arrow that indicates North. This allows participants to draw the map to best fit the paper (or surface) they are drawing on, while including directional information that can be used to orient the map to its surroundings.
3. Key Physical Features.
Maps should include key physical features. The following checklist can help participants observe and capture more complete information:
1.Boundaries.
When drawing the map of the farm, the boundary is the first feature to be defined. Spending time upfront to create an accurate border – shape of the farm is clearly defined and length of lines represent distances on the ground – makes it easy to complete the remaining map by simply adding in key physical features.
There should be no dispute regarding the boundary being drawn. The first step in the Forest Garden process is to plant a fence made of trees, a green wall, to secure the land. The trees provide protection and future income to the farmers, and could be at risk if planted on a disputed border.
2.Cardinal Directions.
Outside the boundary of the farm drawn on the paper, the map should include an arrow that indicates North. This allows participants to draw the map to best fit the paper (or surface) they are drawing on, while including directional information that can be used to orient the map to its surroundings.
3. Key Physical Features.
Maps should include key physical features. The following checklist can help participants observe and capture more complete information:
i. Immovable manmade structures (houses, storage rooms, latrines, sheds)
ii. Water sources (taps, wells, rivers, streams, springs)
iii. Erosion and flooding impact (swamps, seasonally flooded areas, gullies)
iv. Immovable physical features (terraces, bunds, termite mounds)
v. Major variations in slope, identifying high points and low points
vi. Soil type and quality (e.g. very healthy, healthy, degraded, very degraded)
vii. Current vegetation (e.g., agroforestry trees, fruit trees, vegetable garden)
4. Neighboring Area. The map includes things that can be easily seen outside the immediate boundary of the farm and can affect the farm. Examples include:- Neighbors who are rearing bees.
- Dead trees or brush piles next to the field that may attract pests or fire.
- Other fields where pesticides are sprayed.
- Boundaries: Start in one corner of the farm and walk the entire border, using your steps to estimate the length of each side of the field. Each time you arrive at the end of a straight line, draw an equivalent line on paper with the number of steps written next to it. When you make a turn, reflect the angle of the turn or curvature in the line you draw on the paper. Continue this process till you have completed the farm perimeter on the map.
- Cardinal Directions: Add an arrow outside this border to indicate North.
- Key Physical Features: Next add in key physical features within the field itself.
- Neighboring Area: Finally add any neighboring features that could impact the farm.
 Example of a Growing Potential Table to draw on flip chart, wall, or floor. Use words or pictures depending on literacy of the group.
Finally invite the group to vote and pick a map that looks most like the field.
Example of a Growing Potential Table to draw on flip chart, wall, or floor. Use words or pictures depending on literacy of the group.
Finally invite the group to vote and pick a map that looks most like the field.
Top view mapping tips
The use of the top view map aligns with the three key phases of Forest Garden establishment, described Chapter 2. Your role as a facilitator in generating action based on the top view map will evolve and change in each phase. Phase I (Protect) Top view mapping is the very first activity you will undertake with members in module 1 of the Forest Garden training. In this module you will be combining the vision the farmers have for their dream fields with the reality of the current farms as reflected in the maps they create. Creating a flourishing Forest Garden takes time, and depending on the gap between their farms today and what they want, the results of the maps can make the group (and the lead farmer) feel overwhelmed. As a facilitator:- Pay attention to how the group members are feeling in addition to what they are saying.
- Use open ended questions to help the group share their concerns – what are you excited about? What are you concerned about? What would keep you from moving forward towards your goals?
- Share stories of success, and celebrate accomplishments – including the group signing up to create their Forest Gardens, and starting the process of dreaming, mapping, and designing these.
- Use questions to draw attention to aspects they can fine tune (e.g., plant sizes, light requirements, sun directions, soil requirements and impact, effect on pests), gaps they can fill, and plant interactions that will help create thriving plant guilds.
- Helps the group draw advanced top view maps that show tree and plant circumference, and can be used to plan patterns and groups of plants that complement each other.
Side View Mapping
What is side view mapping?
A side view map (also called a vertical map) is a hand drawn picture of the different layers and heights of plants that grow on a farm. This information in turn can be used to identify gaps that can be filled with new and complementary plant species. Forest gardens are strategically designed to cultivate plants that fill space both horizontally (across the ground) and vertically (from belowground to the top of trees’ canopies). Creating tightly knit plants and tree groups that optimize the use of the vertical space available can substantially improve yields even from farm units that are smaller in size.When do I use side view mapping?
Side view maps should be used to:- Inform decisions about which trees, plants, and crops will best diversify the Forest Garden.
- Periodically evaluate and assess opportunities to better utilize and optimize the Forest Garden.
How do I use side view mapping?
The typical Forest Garden can be divided into seven layers, here is a quick summary of each:- Canopy plants: which can be fully grown fruit or nut trees, timber species, or pioneer species that grow quickly and produce shade. This is the tallest layer, averaging over 25 m in height.
- Subcanopy plants: lower plants utilizing some shade of the canopy plants, including coffee plants or small trees such as banana.
- Shrub plants: large bushes or tall annual crops.
- Herbaceous plants: often edible and medicinal plants.
- Vining or climbing plants: plants that climb their way up subcanopy and canopy plants.
- Groundcover plants: shade the soil conserving moisture and prevent soil loss, can be nitrogen fixing.
- Underground or rooted plants: become nutrient pumps for the surrounding soil enhancing its fertility, these often include root vegetables such as potatoes, carrots, tubers, onions, etc.
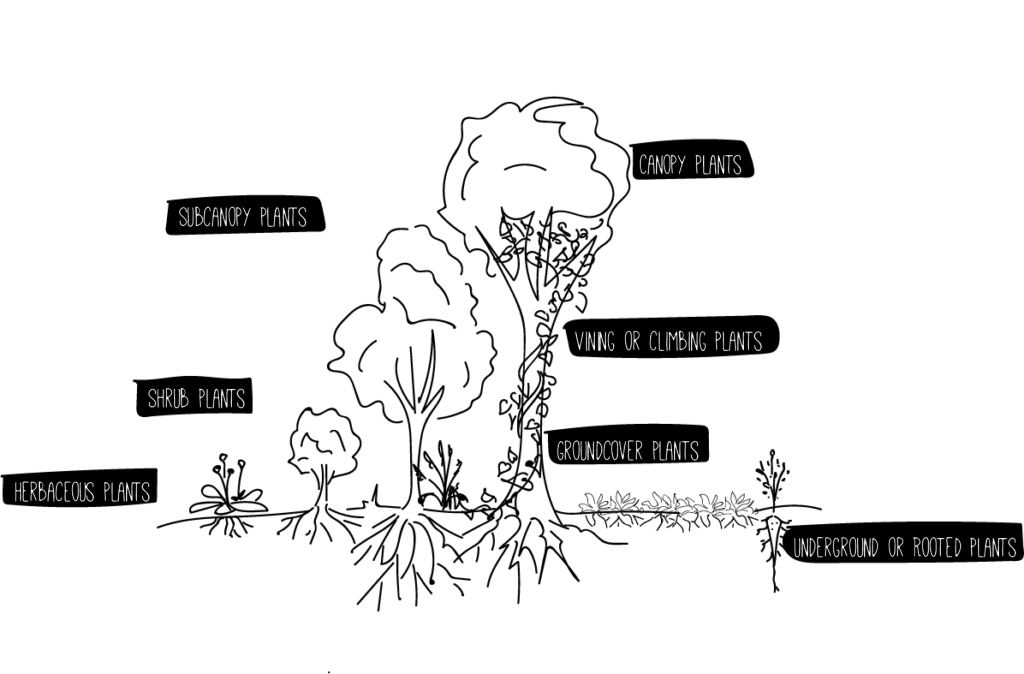 Vertical layers of Forest Gardens (side view)
Based on your knowledge and through talking with experts in your area you can identify specific species that fit in each of these layers. To make the best decision about which new plants will work well, evaluate the following:
Vertical layers of Forest Gardens (side view)
Based on your knowledge and through talking with experts in your area you can identify specific species that fit in each of these layers. To make the best decision about which new plants will work well, evaluate the following:
- Branching structure and height
- Overall circumference
- Root structure
- Soil characteristics and the plant’s interactions with the soil (nitrogen-fixing, weed suppression, moisture retention)
- Sunlight and water requirements
Before the session:
- Draw an example of a side view map on a flip chart paper. Base the sample on a Forest Garden that members have visited, this helps them visualize how they would translate various trees and crops to a simple drawing.
- Identify the transect or path that will be used for the session – most likely on the lead farmer’s field.
- Review the Technical Guide to identify multiple options for perennial plants that the group can grow to fill in the vertical layers of their Forest Gardens.
- Secure materials – roll of flipchart paper, tape, and markers.
Provide a simple explanation to the group on what a side view map is – “just like the top view map shows us what the farm looks like when we look down on the land from above, the side view map shows the different layers of plants in the garden as we see them while walking along a path through the Forest Garden, called a transect walk”.
Show the group a sample of a side view map from a field they have visited as part of the project:
- Ask the group what layers they observe in the sample. Use questions and discussion to help them identify the seven layers of the Forest Garden.
- Next, ask them what plants and trees could fill those gaps. This will help orient the group towards the end goal of the activity.
Form small groups of 4 – 5 people and have them collect materials. Ask each group to take the transect walk and complete the map. This takes approximately 30 minutes.
Have small groups present their maps and have the group select one map that best represents the vertical diversity of plant species on the farm.
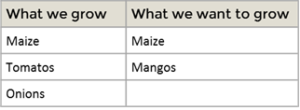
Use a flipchart, wall, or an open ground area to create the following table. You can use chalks for floors or walls, or a stick when working on a dirt floor to draw out the chart. Simply place the side view maps at the top as shown below.
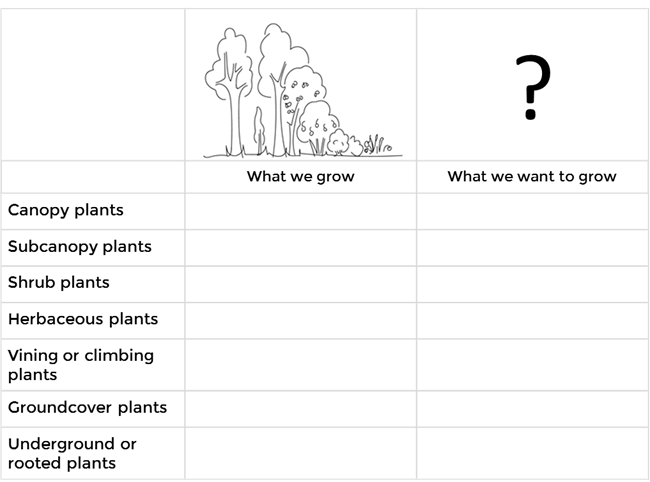
Example of Growing Potential Table to draw on flip chart, wall, or floor. Use words or pictures depending on literacy of the group.
Based on the map, list out the plants that are currently growing on the farm. Ask the group:
- What are the top three gaps to fill to improve the use of vertical space in the Forest Garden?
- Which trees and plants can best fill these gaps?
- Once the group has identified ideas for new plants that can be added, help them think through the following criteria for each to assess fit:
- Will its branching structure and height fit with existing plants?
- When fully grown, will its circumference work with the existing plant groups?
- Will its root structure work with existing plant groups?
- Will the plant’s soil nutrient contributions and needs work with the current soil?
- What are the sunlight and water requirements? Do they work with what will be available?
Side view mapping tips
- When combining side view mapping with other assessment activities (e.g., seasonal calendars, top view mapping) simplify Step 5 to simply brainstorming ideas for trees and plants that could fill vertical gaps. Evaluating whether the identified species are a good fit for the farm given nutrient, water, height, and root considerations can be done after you have completed all the assessment activities.
- Transect walks represent a point-in-time snapshot. For example, the vertical diversity in plant species might look different depending on the season during which the activity is conducted. When listing out plants and trees currently growing on the field, ask the host farmer to share names of seasonal plants that the group cannot currently observe on the field.